







Sales performance
Revenue, orders, AOV, conversion, margin and commercial trends.
Menura AI Data Canvas is a natural-language insight workspace that helps retail teams explore business data, understand performance, and turn findings into action.
Powering Customer Experiences for Leading Retailers Globally

















Explore your business from every angle. Your business already generates the data. Menura AI Data Canvas makes it easier to understand what it is telling you. Ask questions in natural language and explore information across your data sets without building reports, filtering dashboards or writing queries.
Revenue, orders, AOV, conversion, margin and commercial trends.
Segments, loyalty, lifetime value, churn, acquisition and retention.
Demand, category performance, product interest, inventory and purchasing patterns.
Sessions, sources, landing pages, browsing behavior and conversion paths.
Campaign performance, channel contribution, engagement and conversion.
Identify customer groups worth targeting, suppressing or re-engaging.
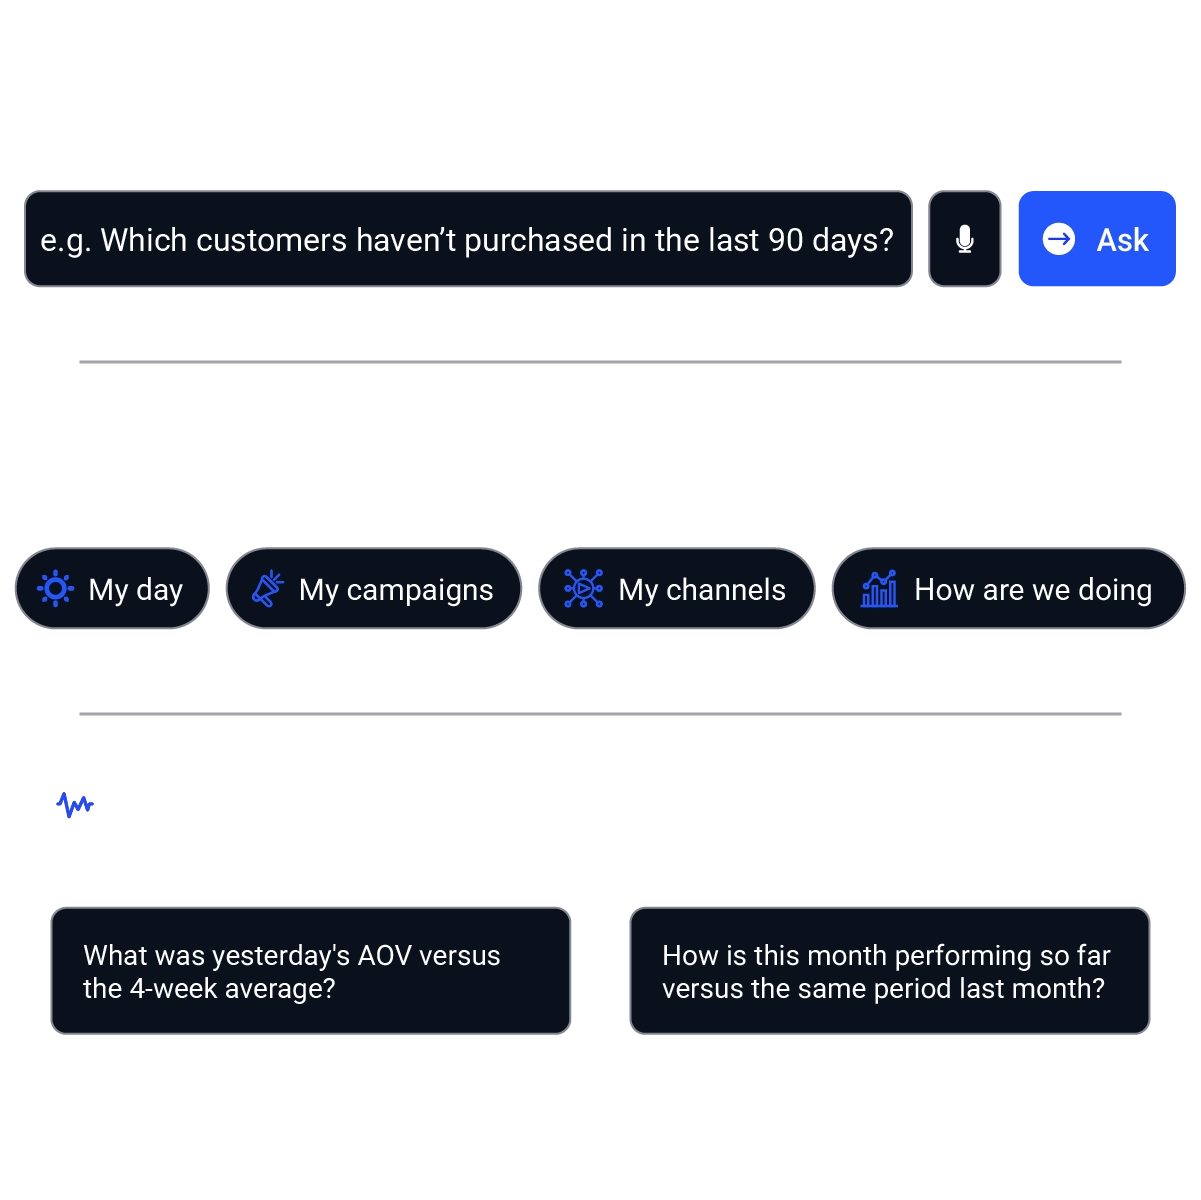
Start with the business question you want answered. Describe what you want to understand in plain language, and Menura AI Data Canvas identifies the data needed to answer it.
And if you don’t know what to ask? Data Canvas includes ready-made prompts and question recipes designed around common retail and eCommerce goals.
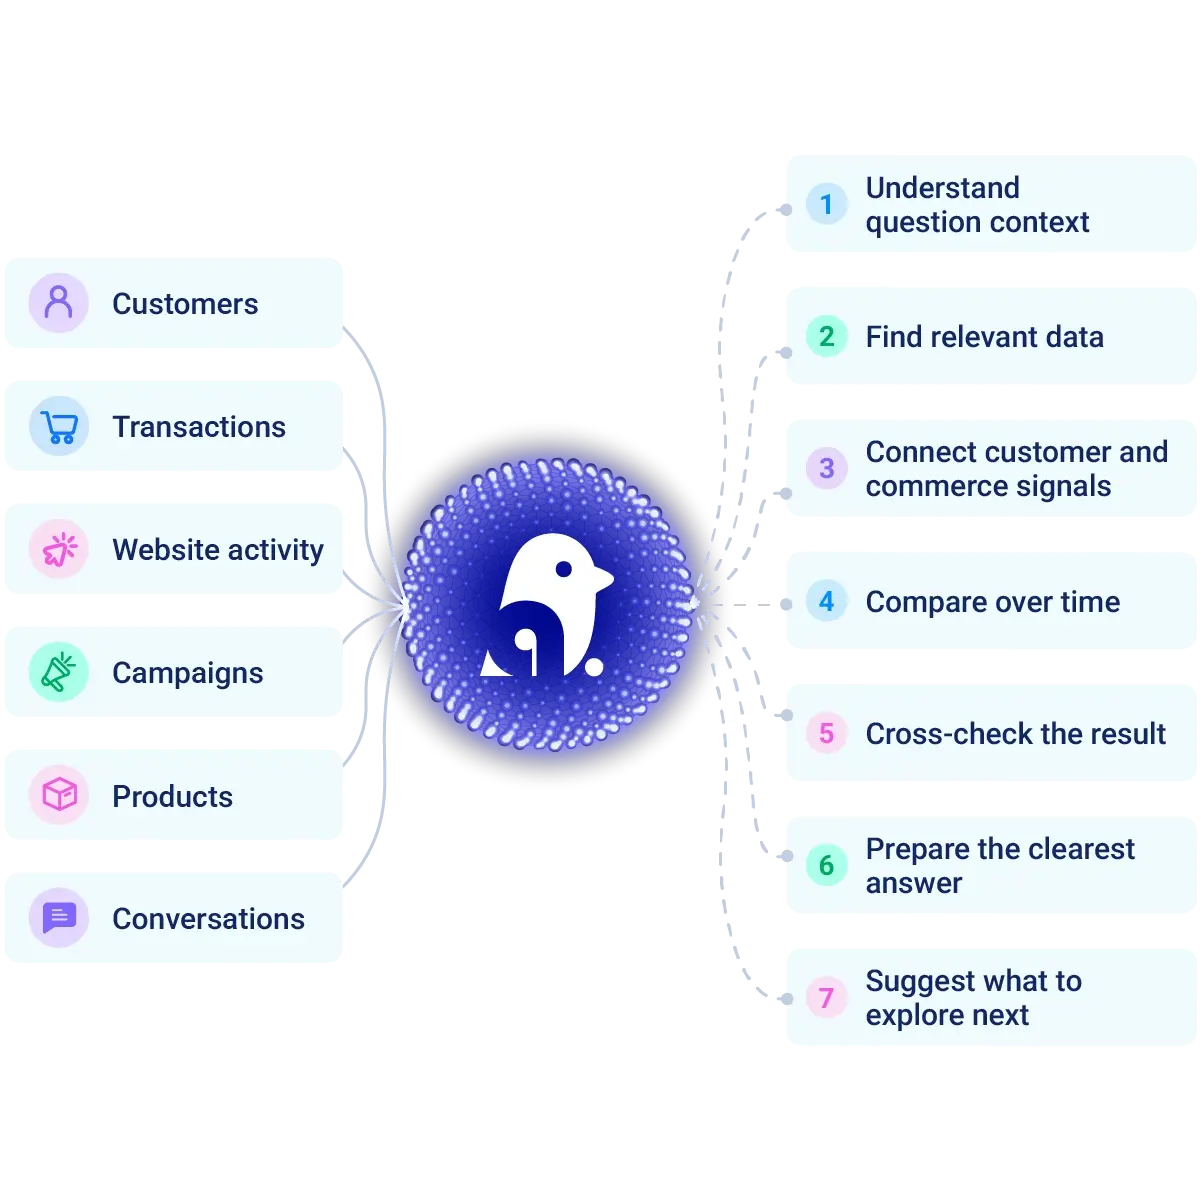
Business questions rarely depend on a single dataset. Data Canvas brings together the relevant information available within your account to support each analysis. You stay focused on the business question while Menura AI handles the underlying data retrieval and analysis.
 Customer profiles
 Transactions
 Website activity
 Products
 Campaign interactions
 Chats
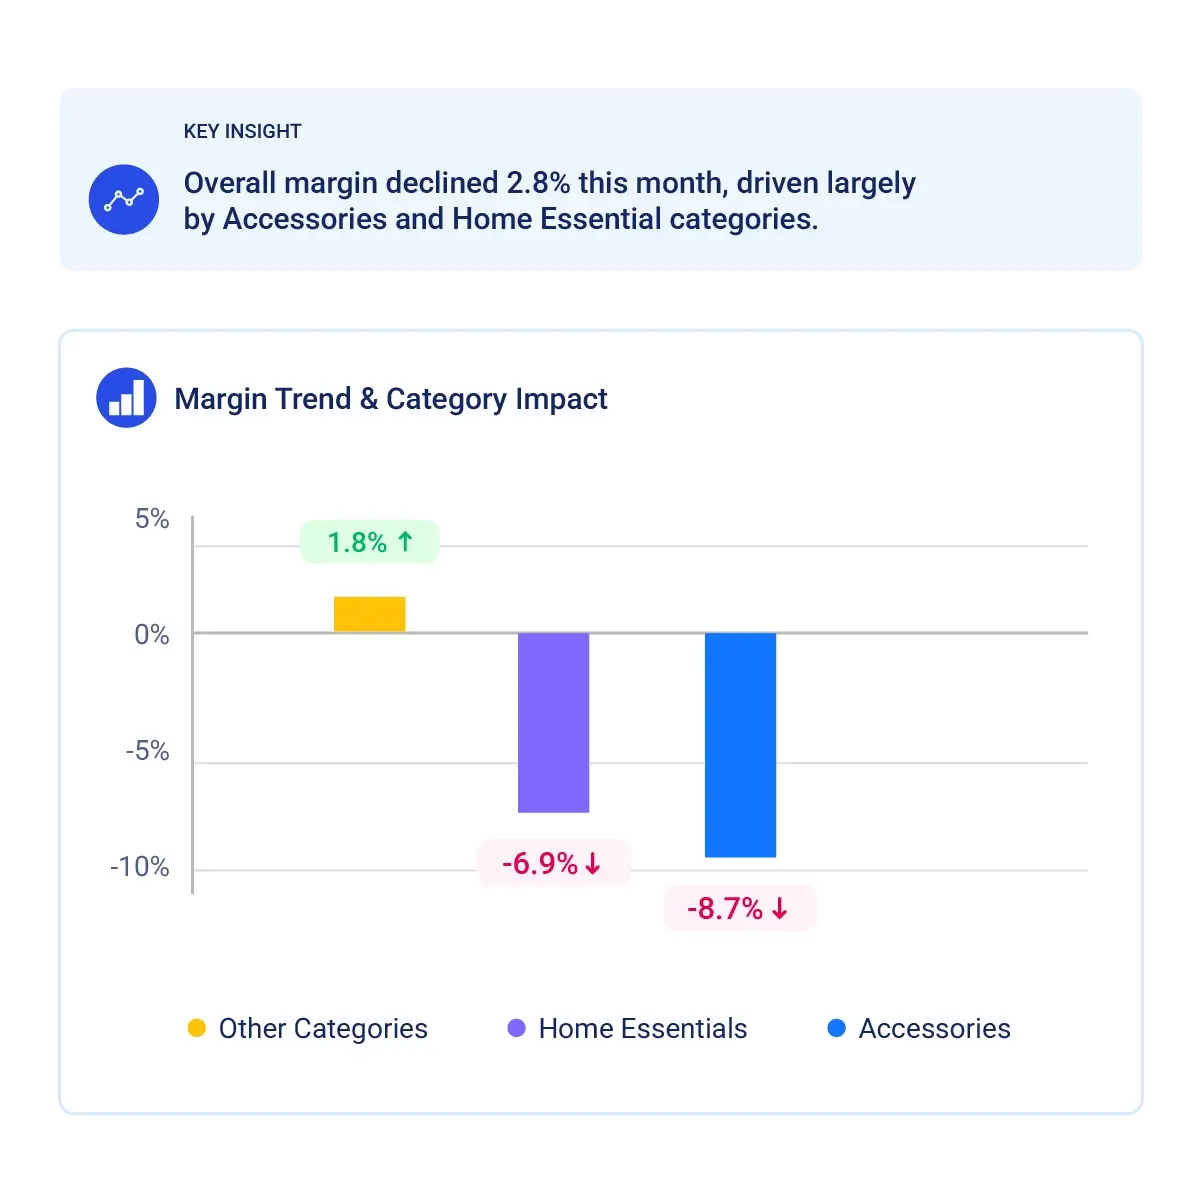
The output shows both the result and the supporting data. Data Canvas summarizes what changed, highlights relevant patterns, and gives you the information needed to understand performance in more detail.
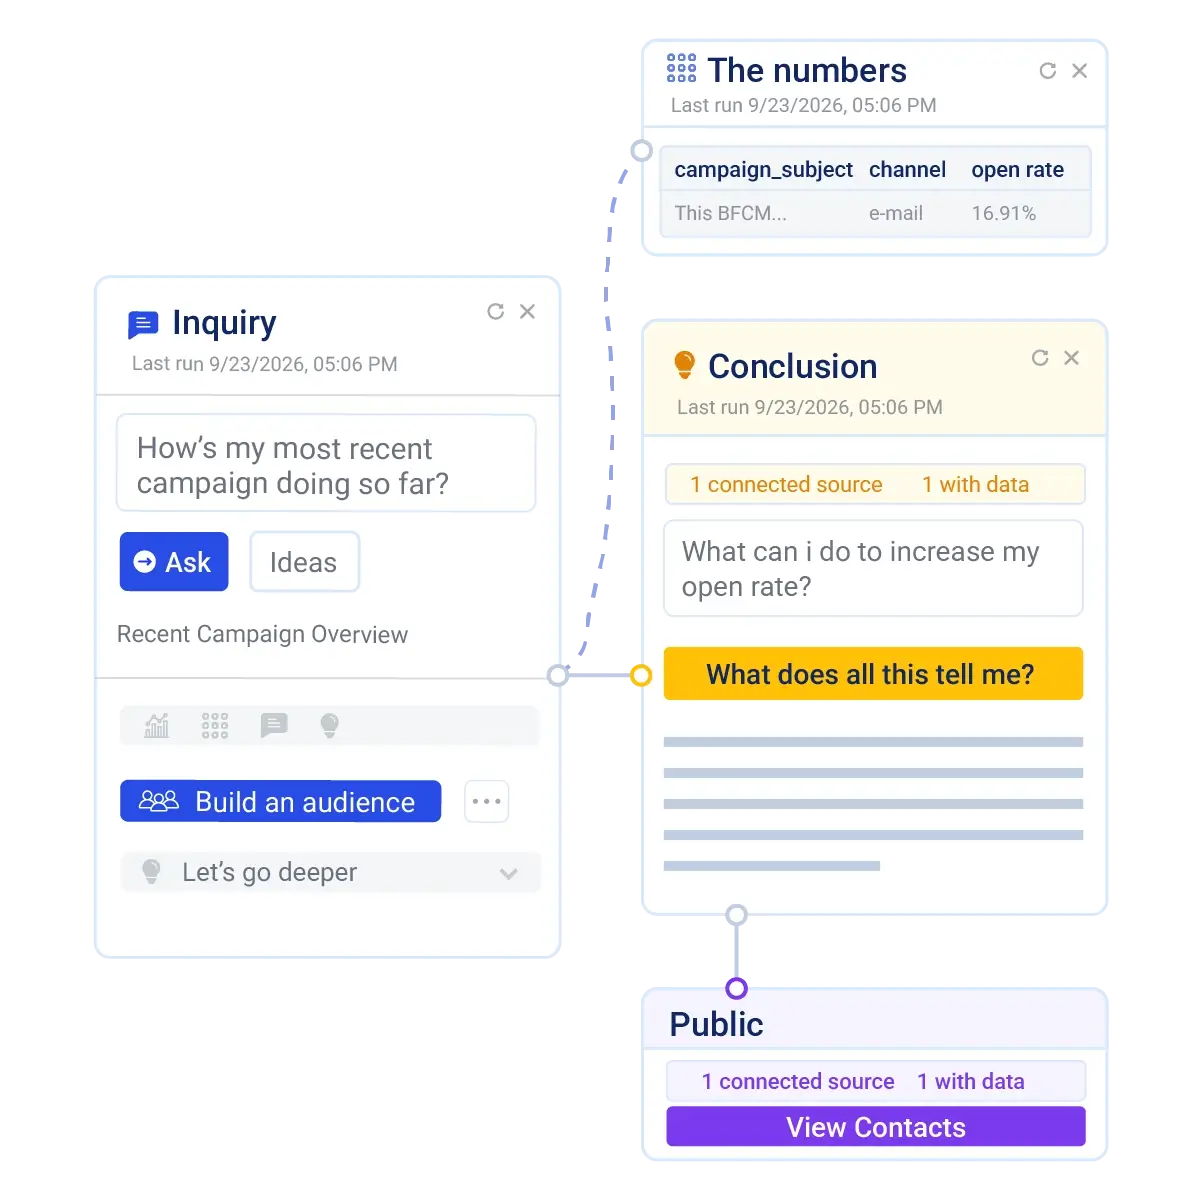
Explore follow-up questions without losing the context behind the first answer. Use My Canvas to connect questions, analyses, charts, tables, and outputs in one visual workspace. Branch from a result, compare different lines of analysis, and keep each step connected to what came before it.
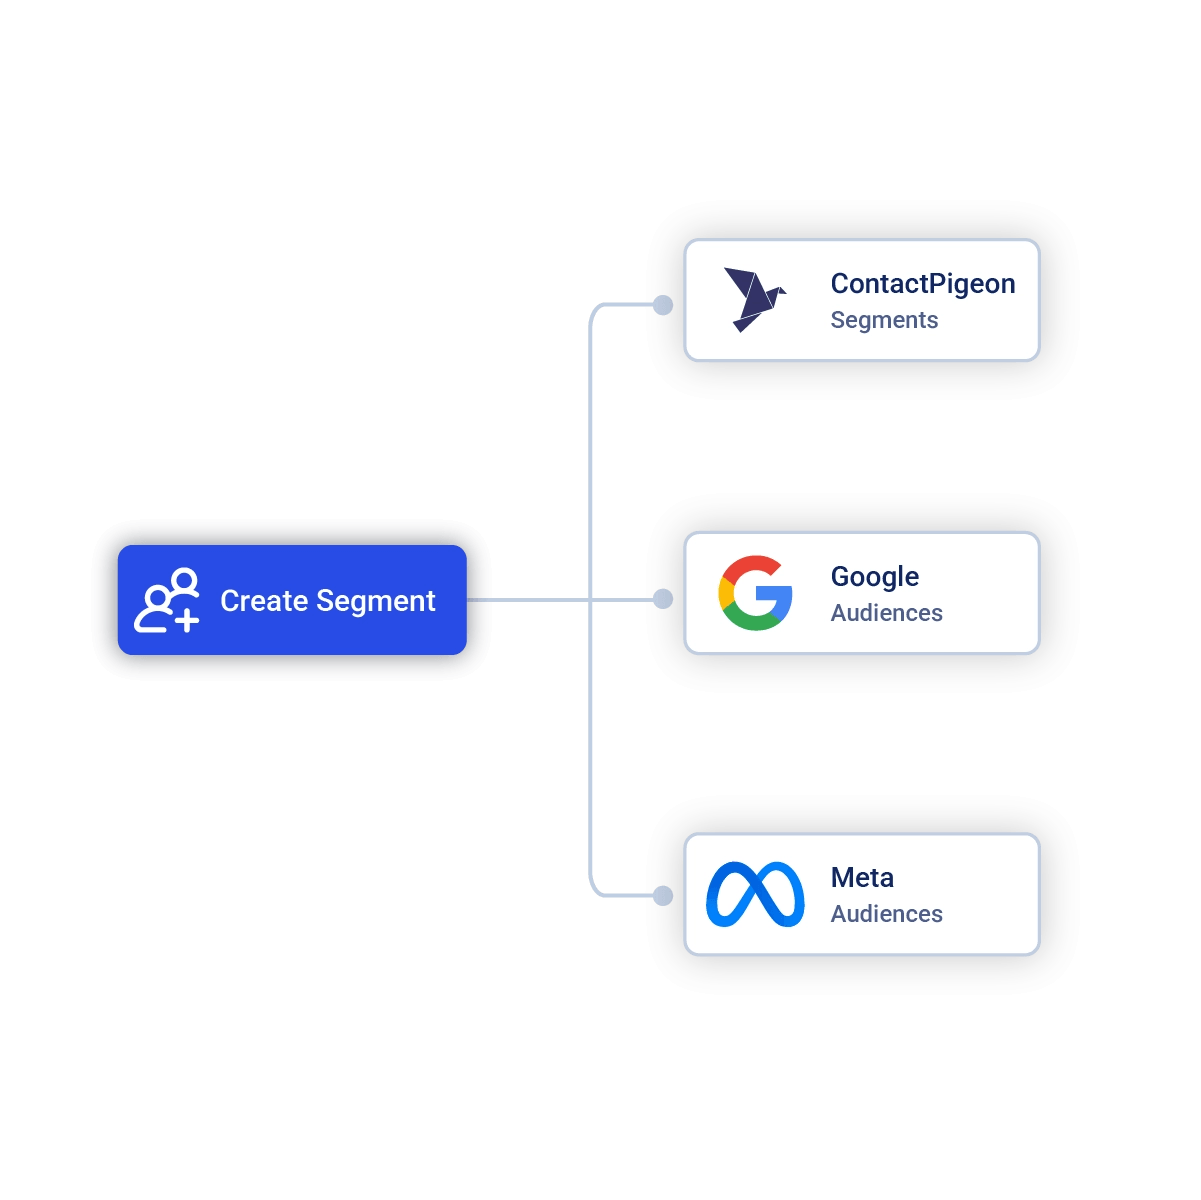
When an analysis reveals a useful customer group, activate it without rebuilding the audience elsewhere. Create the audience directly from Data Canvas and use it in your next engagement strategy.
 Build Segment
 Meta Custom Audience
 Google Audience
Useful analysis should not disappear once the question is answered.
Your Canvas keeps questions, analysis paths, charts, tables, and outputs connected, so teams can return to previous work, reuse proven approaches, and build on what they have already learned.
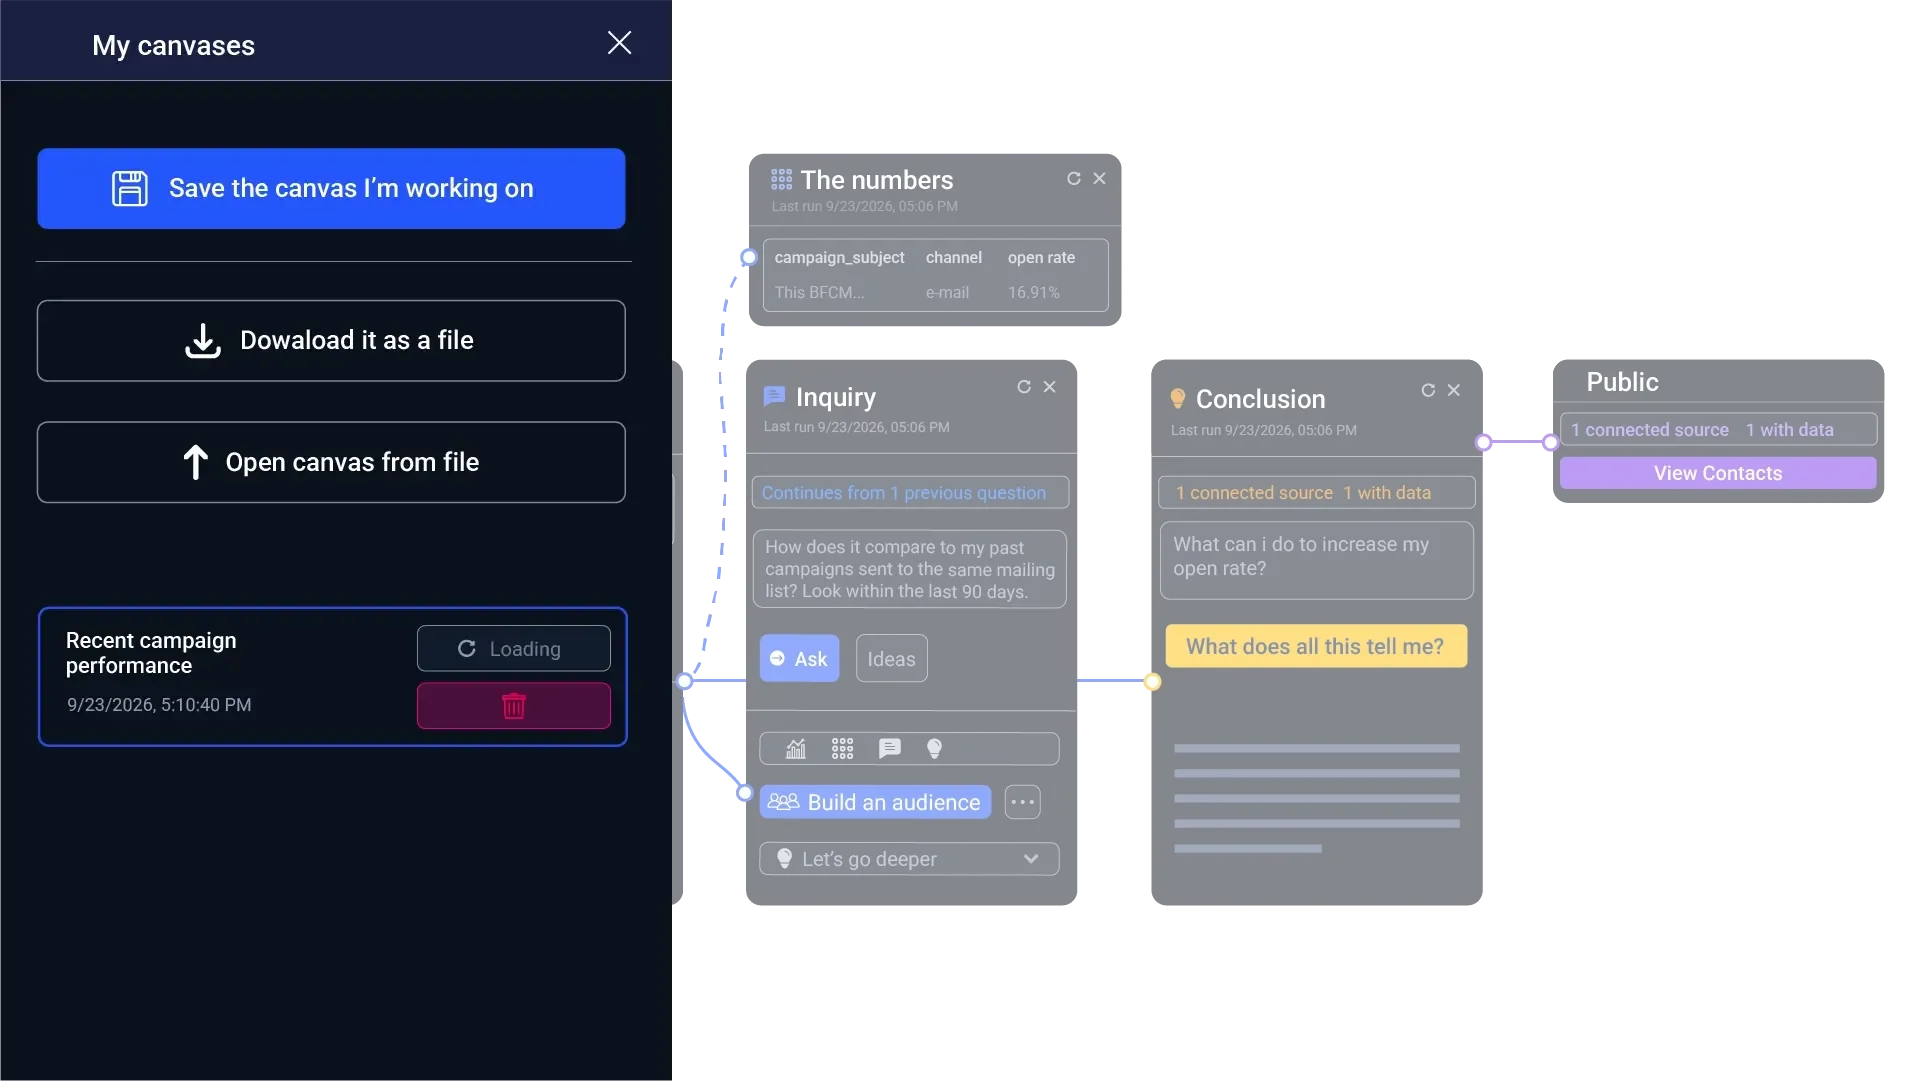
Preserve questions, analysis paths, and outputs so you can continue the analysis later.
Apply the same Canvas structure across different periods, campaigns, categories, or business questions.
Export and import Canvas setups between accounts, useful for multi-brand retailers, retail groups, and agencies.
Data Canvas includes ready-made recipes for recurring retail analysis, from daily performance checks to customer churn, product demand, and campaign effectiveness. Choose a recipe, adapt it to your business, or start with your own question.
See how Menura AI Data Canvas can help your team explore the questions you already ask, understand performance in context, and connect findings to your next action.
Trusted by 500+ brands globally. Rated Top Customer Satisfaction on G2.
Data Canvas doesn’t replace business intelligence. It complements your existing business intelligence by giving retail teams a faster way to explore follow-up questions, keep the context behind their analysis, and activate useful customer findings.
| Traditional analysis | Menura AI Data Canvas | |
|---|---|---|
| Access to data | Navigate between tools, dashboards, and data sources | Explore connected business data in natural language |
| From analysis to action | Move through multiple steps before activation | Analyze and activate within the same workspace |
| Ease of exploration | Rebuild filters and reports for each new question | Branch from results and explore follow-up questions |
| Continuity and reusability | Insights are often scattered or recreated | Save and reuse analyses through My Canvas |
| Cross-team dependency | Multiple handoffs across teams | Fewer handoffs and more self-service |
Data Canvas is one of the ways Menura AI puts ContactPigeon's retail intelligence to work.
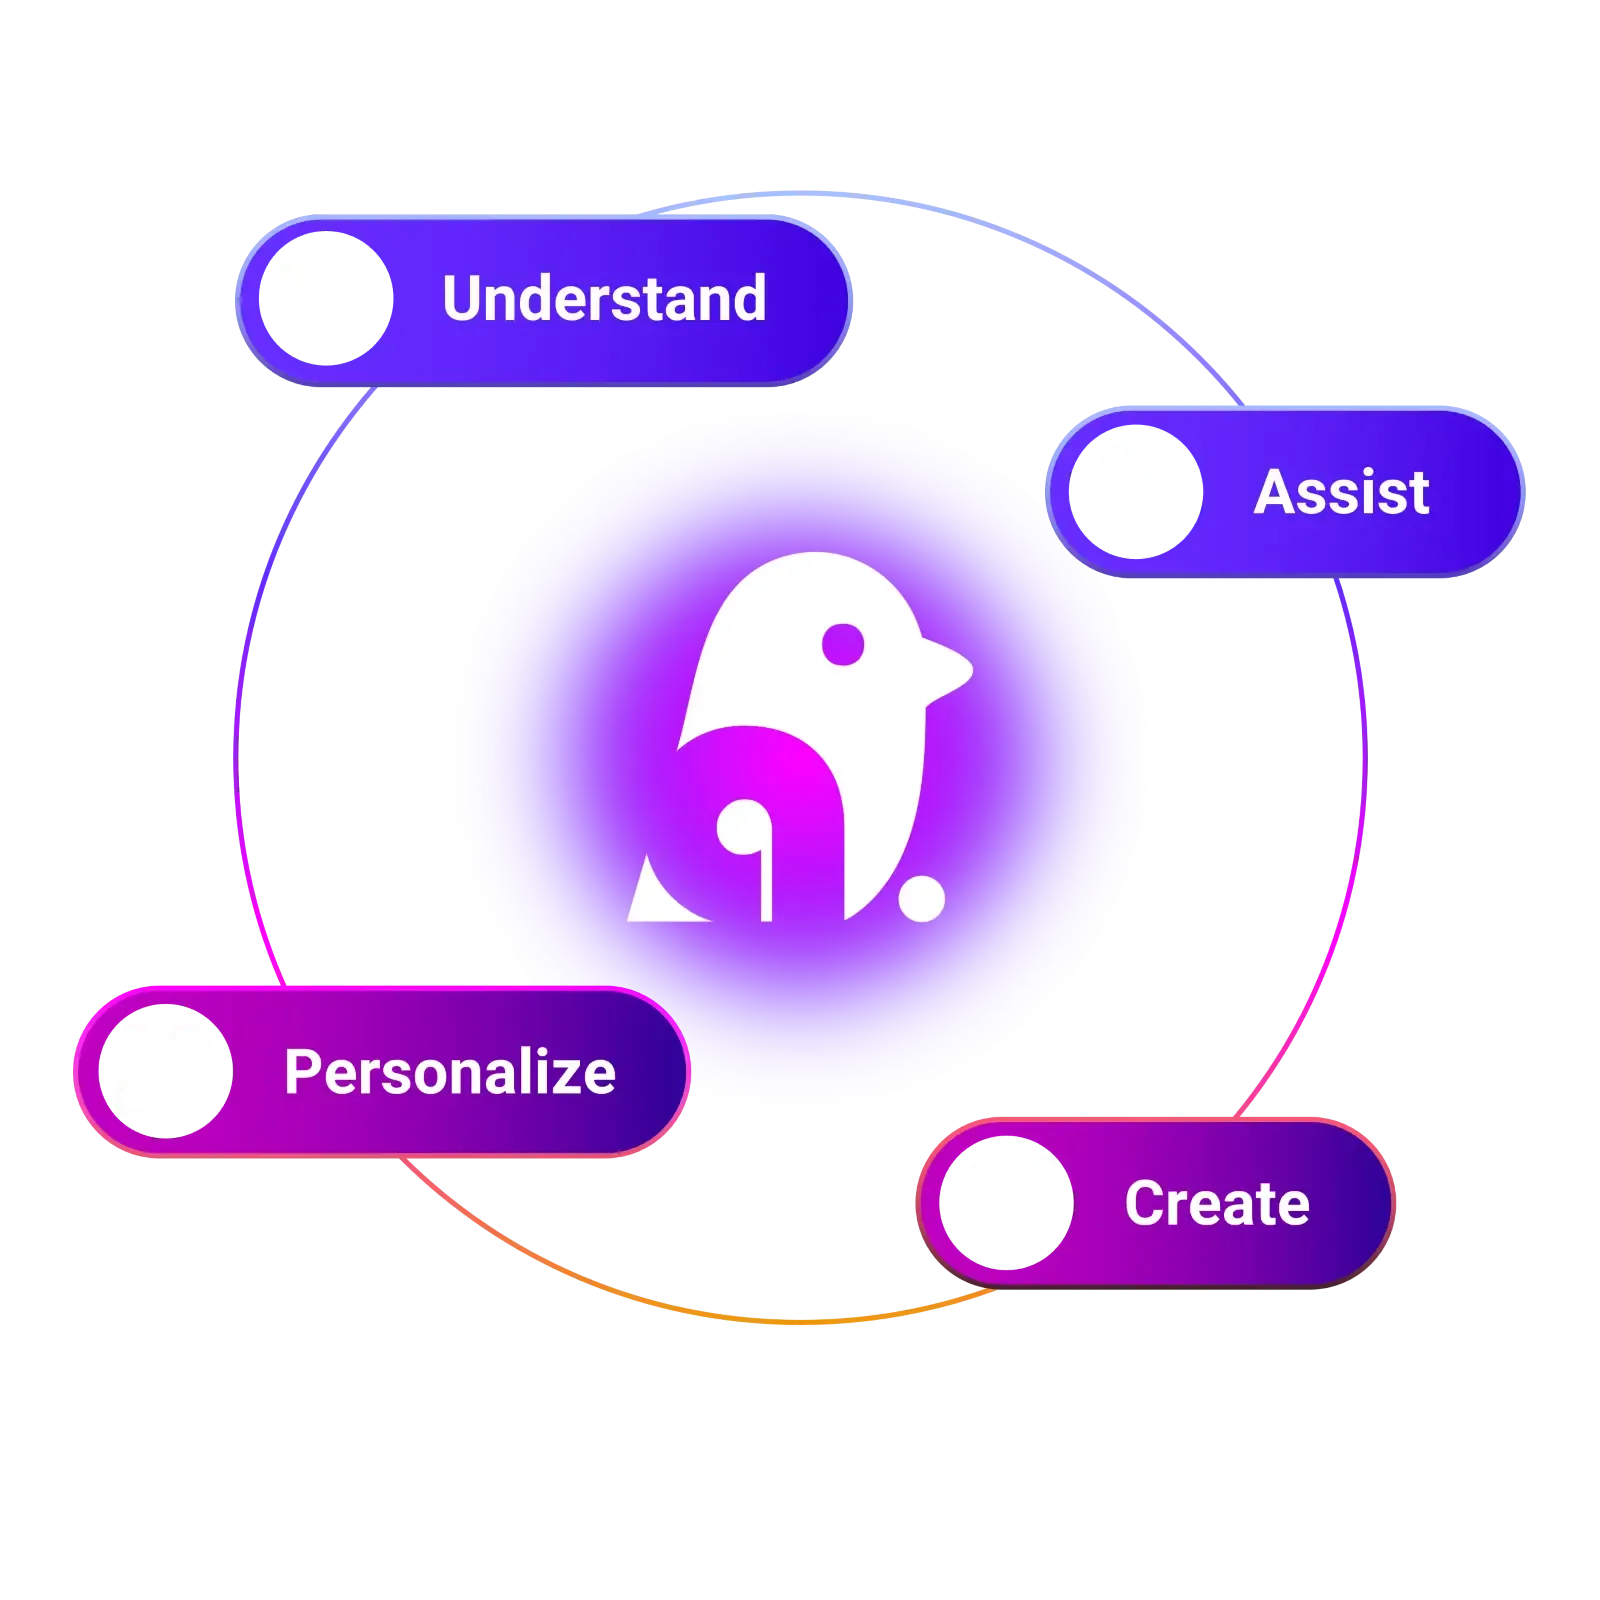
Menura AI connects customer and commerce data with AI reasoning to help retail teams understand, engage, create, and personalize every part of a customer journey.
The intelligence layer
The intelligence layer that powers smarter customer experiences, from conversational assistants and business intelligence to autonomous agents that act on real-time context.
Learn more →Guide shoppers through discovery, purchase, and support.
Explore agent →Ask questions, uncover insights, and create smarter audiences.
Explore agent →Create high converting content and campaigns with one prompt.
Determine the most relevant next experience for each customer based on a set goal.
Menura AI Data Canvas is a natural-language analytics workspace that helps retail teams explore customer, commerce, campaign, and behavioral data.
Teams can ask business questions, examine supporting data, explore follow-up analyses, save their work in My Canvas, and turn useful customer findings into audiences.
My Canvas is the visual workspace inside Data Canvas where you can connect questions, analyses, charts, tables, and outputs.
It allows you to follow different paths of analysis, return to previous work, and reuse Canvas structures for future business questions.
You can explore sales performance, customers, products, website behavior, campaigns, and audience opportunities.
Data Canvas also includes ready-made recipes for recurring retail and eCommerce questions, which you can adapt to your own business.
No. Data Canvas is designed for natural-language exploration, so you can work with your data without writing queries, rebuilding filters, or navigating between multiple reports.
Yes. When an analysis identifies a useful customer group, you can turn it into an audience directly from Data Canvas and use it in your engagement strategy.
Yes. My Canvas lets you save questions, analysis paths, and outputs, reuse proven Canvas structures, and move Canvas setups between accounts when working across brands, retail groups, or agencies.

